
by Neil Azous, Chief Investment Officer
Interest rates are at the Effective Lower Bound (ELB). The Federal Reserve is attempting to engineer inflation. Traditional core bond portfolios are yielding less than 1.00%. Income seekers are acutely aware of the predicament they are in – that is, traditional fixed income products will most likely not deliver the real-world outcomes investors seek.
With the wide-spread acknowledgment that investors must move beyond traditional bond asset classes to achieve their income needs, the question often asked is: How much more volatility are you willing to accept in exchange for higher levels of yield?
We believe the answer to that question must be quantitative. Also, these three critical factors must be taken into consideration.
- Do you look back 3 years (i.e., intermediate-term) or 10 years (i.e., long-term), or both?
- Do you use daily, weekly, or monthly volatility, or a combination?
- Can you create a “like-for-like” yield comparison across asset classes?
To best represent our findings, we introduce two methodologies. The first one is potentially suitable for tactical/dynamic asset allocators. The second one is designed for long-term holders of assets.
Our primary conclusion is that non-traditional products deliver a high-quality yield for the additional risk that is taken. Moreover, we demonstrate that investors may achieve substantially more yield with diversification benefits than the high yield asset class without taking significantly more risk.
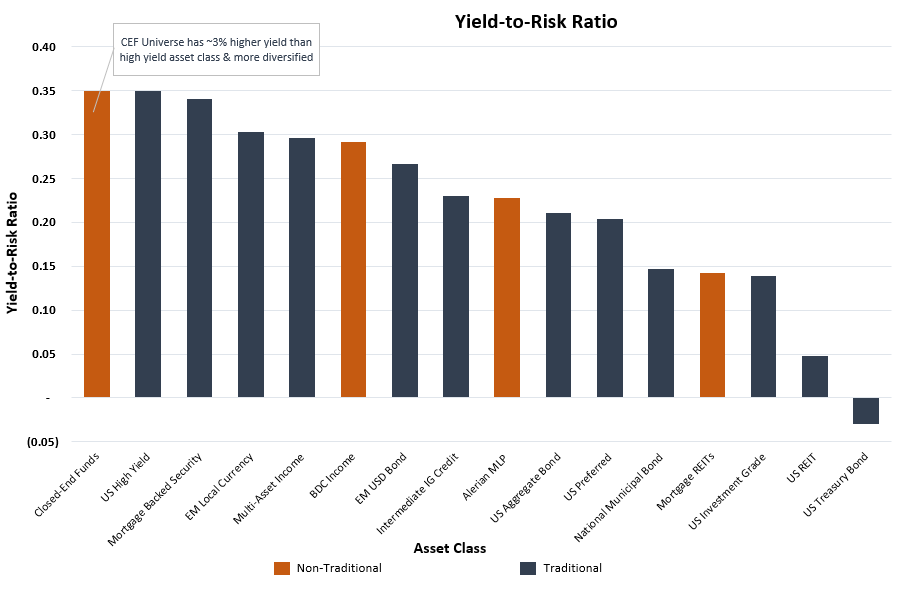
Methodology 1 – Yield-to-Risk Ratio
We define the yield-to-risk ratio as the current yield of an asset class minus the 10-year US Treasury yield divided by three-year annualized volatility, based on daily observations.
Firstly, by removing the risk-free portion of the yield and focusing solely on the yield’s credit component, the output is the current yield per unit of risk.
Secondly, we look back for three years using daily observations. The output, therefore, incorporates the current pandemic and the 2018 Federal Reserve interest rate hiking cycle. Said differently, short-term drawdown risk plays a greater role in determining the ratio.
This formula generates a “like-for-like” yield comparison across asset classes on an intermediate-term basis with different levels of volatility.
This methodology is optimal for tactical or dynamic asset allocators as drawdown risk on an intermediate-term horizon is important.
The below table shows the yield-to-risk ratio of various income-oriented asset classes. The orange bars depict non-traditional, and the blue bars illustrate traditional asset classes.
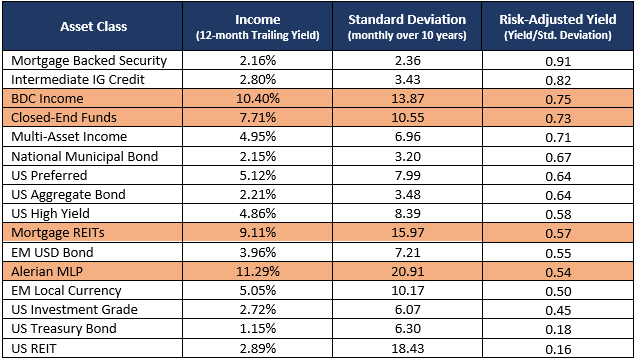
Methodology 2 – Risk-Adjusted Yield (RAY)
Risk-adjusted Yield (RAY) is measured by the yield per unit of risk, where risk is defined as the standard deviation of monthly total returns over the last 10 years divided by the 12-month trailing yield.
Firstly, analyzing a trailing yield relative to historical volatility helps calculate the income generated per unit of risk on a smoothing basis. The higher the ratio, the better RAY being offered by that asset class.
Secondly, by looking back 10 years using monthly observations, we eliminate recency bias, including the pandemic in 2020 and the Federal Reserve hiking cycle in 2018.
This methodology is prudent for long-term income seekers or those looking for cash flow enhancers over market cycles. Short-term drawdown risk is less of a consideration, as is separating the risk-free versus the credit component of the yield like in the previous methodology. After all, over long periods, total return and yield strategies converge since, in the long-term, 99+% of total return is due to yield.
The table below illustrates the RAY of various income-oriented asset classes. (see far right column)
Conclusion
The yield-to-risk ratio and risk-adjusted yield are important metrics when analyzing the level of risk taken to achieve a yield. When marrying both methodologies, we find the following observations relevant:
- Methodology 1 highlights that closed-end funds and the high yield asset classes score the highest on an intermediate-term basis. That is, current yields are attractive on both an absolute basis and adjusted for their higher risk, relative to other yield-oriented asset classes.
- Methodology 2 demonstrates that the non-traditional advantages of closed-end funds provide more benefit than the high yield asset class over the long-term. That is, the closed-end fund universe yield is almost 3% higher and provides diversification benefits over a single asset class.
- Relying on US Treasury bonds to add income or act as a ballast in a portfolio has an asymmetric reward-to-risk ratio to the downside because of the absolute low level of yields. In Methodology 1, US Treasuries were the only asset class to have a negative ratio, and Methodology 2 resulted in this asset class having the second-lowest RAY.
As a boutique firm, we can support your business by providing direct access to our investment professionals and library of tools. We would be pleased to schedule an analysis of your income strategies to help you determine if you are taking the appropriate level of risk relative to the yield you are receiving. At Rareview Capital, our goal is to become a trusted resource and the first call for your questions. Please call us at 212-475-8664 or email us at info@rareviewcapital.com.
Disclaimer
This material is for informational purposes only and does not constitute an offer or a solicitation to buy, hold, or sell an interest in any investment or any other security, including any investment with Rareview Capital LLC (“RVC”) or any of its affiliates or any other related investment advisory services. This material is not designed to cover every aspect of the relevant markets and is not intended to be used as a general guide to investing or as a source of any specific investment recommendation. This material does not constitute legal, tax, or investment advice, nor is it a substitute for such professional advice or services, nor should it be used as a basis for any decision or action that may affect your business. Before making any decision or taking any action that may affect your business, you should consult a qualified professional adviser. All opinions and views constitute our judgments as of the date of writing and are subject to change at any time without notice. In preparing this material, RVC has relied upon data supplied by third parties. RVC does not undertake any obligation to update the information contained herein in light of later circumstances or events. RVC does not represent the information herein is accurate, true or complete, makes no warranty, express or implied, regarding the information herein, and shall not be liable for any losses, damages, costs or expenses relating to its adequacy, accuracy, truth, completeness or use. This material is subject to a more complete description and does not contain all of the information necessary to make any investment decision, including, but not limited to, the risks, fees and investment strategies of an investment. All investments carry a certain degree of risk, including the possible loss of principal. There is no assurance that an investment will provide positive performance over any period of time. There are specific risks that apply to investment strategies. Securities highlighted or discussed in this communication are mentioned for illustrative purposes only and are not a recommendation for these securities. RVC actively manages client portfolios and securities discussed in this communication may or may not be held in such portfolios at any given time. Closed-end funds frequently trade at a discount to their net asset value. These risks should be reviewed carefully before taking any investment action. Since no one investment style or manager is suitable for all types of investors, this site is provided for informational purposes only. The statements contained herein are the opinions of RVC. This site contains no investment advice or recommendations. Individual investor results will vary. Rareview Capital LLC expressly disclaims all liability in respect to actions taken based on any or all of the information on this writing. Past performance is no guarantee of future results.