
THE MOST IMPORTANT OBSERVATION IN YOUR PORTFOLIO YOU PROBABLY AREN’T AWARE OF
by Neil Azous, Chief Investment Officer
- THE 40% BOND ALLOCATION – NOW SECOND LARGEST DRAWDOWN IN HISTORY
- CAN IT GET WORSE?
- PORTFOLIO CONSTRUCTION IMPLICATIONS
- WHAT’S NEXT
INTRODUCTION
The size of the global bond market (i.e., total debt outstanding) is $119 trillion worldwide. The United States accounts for $46 trillion or 39% of the market.¹ Said differently, “as the U.S. goes, so goes the rest of the world.”
The dominant industry portfolio is the “60/40 stock-bond portfolio.” It is a guidepost for a moderate risk investor – a 60% allocation to equities to provide capital appreciation and a 40% allocation to fixed income to potentially offer income and risk mitigation.
Currently, with inflation the highest in 40 years and the Federal Reserve expected to begin raising interest rates shortly, the 40% allocation to fixed income is no longer acting as the ballast in a portfolio.
That said, do you know the degree of the stress in which fixed income is under and what you are supposed to do next?
Below, we show you the magnitude of the PnL duress and provide portfolio construction guidance, including a “rare view.”
THE 40% BOND ALLOCATION – NOW SECOND LARGEST DRAWDOWN IN HISTORY
The benchmarks representing the “60/40 stock-bond” portfolio are the S&P 500 Index and U.S. Aggregate Bond Index.
The U.S. Aggregate Bond Index is a broad-based flagship benchmark that measures the investment grade, U.S. dollar-denominated, and fixed-rate taxable bond market. The index includes U.S. Treasuries, corporate securities, mortgage-backed securities (agency fixed-rate pass-throughs), asset-backed securities, and commercial mortgage-backed securities (agency and non-agency).
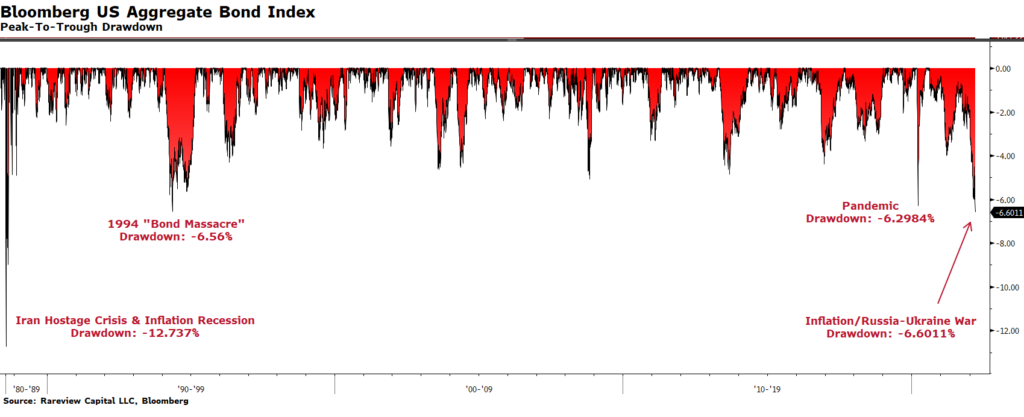
Last week, the U.S. Aggregate Bond Index peak-to-trough drawdown surpassed the sell-off during both the pandemic and 1994 “Bond Massacre.” The current decline is now the second largest in history.
Below are the most significant peak-to-trough drawdowns in the bond markets history:
- 2020 Pandemic: -6.294%
- 1994 Bond Massacre: -6.56%
- 2022 Inflation & Russia-Ukraine War: -6.6011%
- 1980 Iran Hostage Crisis & Inflation Recession: -12.737%
Another way to quantify the tectonic loss in the bond market is to measure it on a risk-adjusted return basis relative to the U.S. stock market.
Over the last five years, the volatility of the S&P 500 is 19.98 relative to 3.74 for the U.S. Aggregate Bond Index or 5.34 times greater. Therefore, the current drawdown of -6.6011% in the U.S. Aggregate Bond Index equates to a -35.25% sell-off in the S&P 500. As a yardstick, during the pandemic, the S&P 500 peak-to-trough drawdown, including intraday prices, was -35.41%.
You can adjust the lookback period (i.e., 10 years, 20 years, 30 years, etc., instead of 5 years), but it’s all going to result in the same outcome. That is, this drawdown is well beyond a significant correction – it is a catastrophic loss!
CAN IT GET WORSE?
Measuring the distance between the current sell-off (i.e., -6.6011%) and the worst drawdown in 1980 (i.e., -12.737%) argues that the sell-off could get much worse.
Secondly, linking the 1980 drawdown to an event – the Iran Hostage Crisis and Inflation Recession – suggests the drawdown could continue.
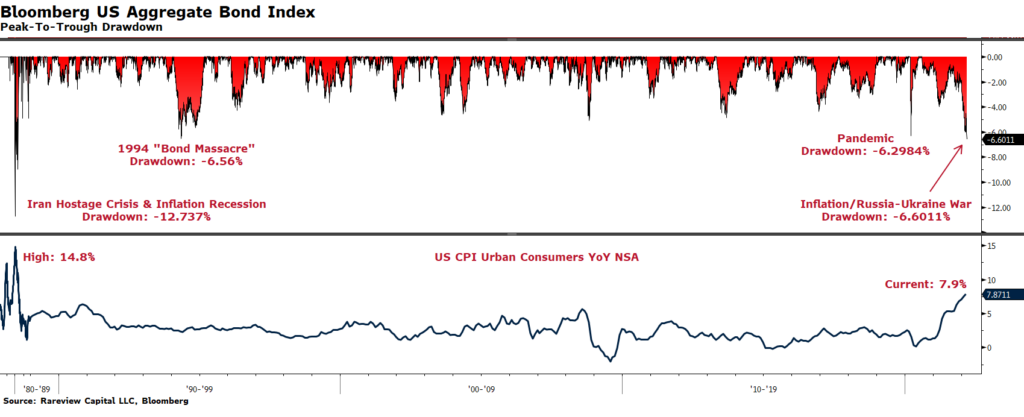
Thirdly, evaluating the current bond market drawdown in conjunction with the Consumer Price Index (CPI) points to the same outcome – even more PnL duress if the recent inflation trajectory results in similar price pressures as 1980.
Finally, we ask if there is any Sight Beyond Sight® that can offset the pedestrian findings above? The answer is YES.
- Our Name: We seek to bring a ‘rare view’ to investment challenges. We place value on being able to see across asset classes, discover new opportunities, and spot impending danger. We call this perspective Sight Beyond Sight®.
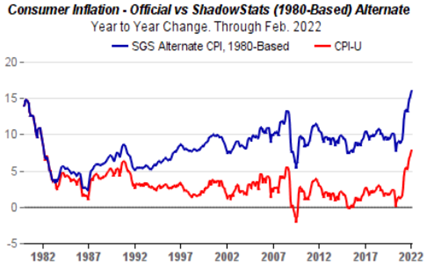
Applying the 1970’s methodology for how CPI was calculated to today’s index, CPI is now 16% year-on-year, or higher today than it was in 1980 when the U.S. Aggregate Bond Index recorded its most significant peak-to-trough drawdown! Therefore, the primary argument for further bond market weakness – “1970s-style inflation – is greatly diminished.
PORTFOLIO CONSTRUCTION IMPLICATIONS
Historically, a decline of more than 4% is abnormal for the U.S. Aggregate Bond Index. There have been only seven times in history where the index fell more than 4%. Over the following six months, it has been very advantageous to be invested in high-grade bonds. In each instance during that period, the probability of a positive total return was 100%, and the Sharpe ratio (i.e., risk-adjusted return) was greater than 2.0.
Secondly, one of the critical misperceptions in investing is that when the Fed embarks on an interest rate hiking cycle, it is a negative for a portfolio of U.S. Treasury investments. It is the opposite. In our recent white paper, “A ‘Rare View’ That Pinpoints The Neutral Rate Before A Hiking Cycle Begins“, we provide evidence regarding why U.S. Treasury returns are now skewed positive. This is critical to recognize because Government securities have the most significant asset class weighting of ~44% in the U.S. Aggregate Bond Index.
Finally, bond math portends to positive total returns in short or intermediate-duration fixed income. Presently, the breakeven interest rate by the end of the year for high-grade bonds with a duration between two and five years entails a yield increase of more than 70 basis points, depending upon the maturity. If you stretch the horizon out to the end of 2023, a U.S. Treasury interest rate above 5% is required to lose money.
WHAT’S NEXT
We believe the rate of change for any further bond market weakness will slow dramatically.
While structurally high inflation could create the specter of even higher interest rates, the more significant impact from this junction is likely to be on the shape of the yield curve. This is especially true considering the Federal Reserve is set to raise interest rates this week for the first time this cycle.
Our work suggests that the likely outcome of this environment is a steeper yield curve where longer-dated bonds may underperform relative to shorter-duration securities.
Finally, monetary policy has the potential to be substantially more erratic than what we have experienced in the past few decades. For example, following the largest historical drawdown in the U.S. Aggregate Bond Index in March 1980, the Fed cut interest rates by 8.5% at its following meeting. At the meeting before this rate cut, the Fed had raised interest rates by 5%. The U.S. Aggregate Bond Index gained more than 20% in under three months following the interest rate cut.
Do we think this severity of policy adjustments could happen in either direction? Probably not. But with inflation this elevated, it highlights that the linear path that has dominated Fed policy since 1990 will likely be non-linear, at least for this cycle.
The critical question for your bond portfolio is whether it is prepared to weather much higher volatility because of monetary policy? This bodes well for active, tactical fixed income management, especially managers like us, that specialize in navigating the contours of the Federal Reserve path.
Rareview Capital LLC is a registered investment adviser and ETF sponsor. We build goals-based investment management strategies that can be accessed through ETFs, sub-advisory/dual contract, model portfolios, or by opening an account directly with us.
If you have any questions or would like to hear more about our ETFs, please call us at 212-475-8664, or email us at info@rareviewcapital.com.
SOURCES
¹Securities Industry and Financial Markets Association (SIFMA)
DISCLAIMER
This material is for informational purposes only and does not constitute an offer or a solicitation to buy, hold, or sell an interest in any investment or any other security, including any investment with Rareview Capital LLC (“RVC”) or any of its affiliates or any other related investment advisory services. This material is not designed to cover every aspect of the relevant markets and is not intended to be used as a general guide to investing or as a source of any specific investment recommendation. This material does not constitute legal, tax, or investment advice, nor is it a substitute for such professional advice or services, nor should it be used as a basis for any decision or action that may affect your business. Before making any decision or taking any action that may affect your business, you should consult a qualified professional adviser. All opinions and views constitute our judgments as of the date of writing and are subject to change at any time without notice. In preparing this material, RVC has relied upon data supplied by third parties. RVC does not undertake any obligation to update the information contained herein in light of later circumstances or events. RVC does not represent the information herein is accurate, true or complete, makes no warranty, express or implied, regarding the information herein, and shall not be liable for any losses, damages, costs or expenses relating to its adequacy, accuracy, truth, completeness or use. This material is subject to a more complete description and does not contain all of the information necessary to make any investment decision, including, but not limited to, the risks, fees and investment strategies of an investment. All investments carry a certain degree of risk, including the possible loss of principal. There is no assurance that an investment will provide positive performance over any period of time. There are specific risks that apply to investment strategies. Since no one investment style or manager is suitable for all types of investors, this site is provided for informational purposes only. The statements contained herein are the opinions of RVC. This site contains no investment advice or recommendations. Individual investor results will vary. Rareview Capital LLC expressly disclaims all liability in respect to actions taken based on any or all of the information on this writing. Past performance is no guarantee of future results.
Other important risk considerations, products, or terminology:
- The Sharpe ratio is a measure of risk-adjusted return. It describes how much excess return you receive for the volatility of holding a riskier asset.