
A Way to Participate In The Equity Market With Reduced Risk
by Neil Azous, Chief Investment Officer
As a long-time derivative specialist, I believe that equity volatility is driven by two key variables, one technical and one fundamental.
Technically, equity volatility follows correlation. Fundamentally, equity volatility is led by corporate earnings.
When analyzing the record low equity volatility environment in 2017, we attribute this dynamic to these two variables.
From the day of the US Presidential Election and over the next two months, realized correlation across regions and asset classes crashed.
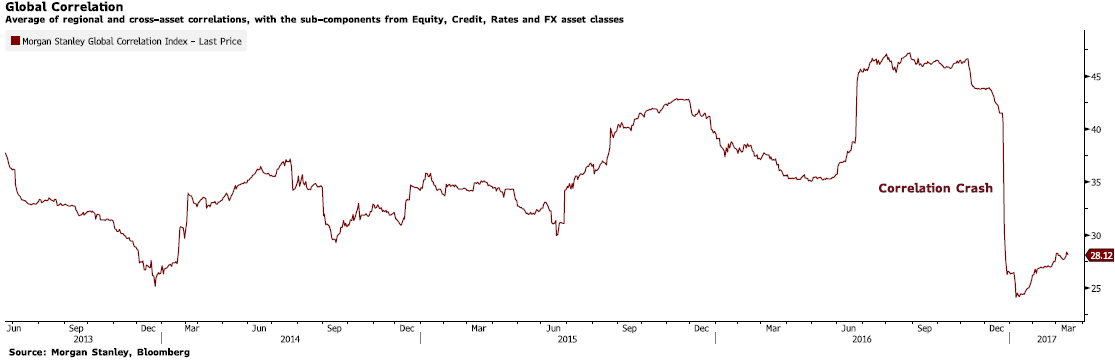
In the second half of 2017, at a very fast pace, investors repriced US corporate earnings growth higher in anticipation of new tax policy. For example, the year-on-year growth rate for the S&P 500 EPS estimates increased close to 30% from 8-10% normally.
Fast forward to today, and these two key variables are saying something different. Also, there is the added headwind of the Federal Reserve tightening cycle and balance sheet runoff, which was not nearly as deliberate last year.
Firstly, realized correlation across regions and asset classes is at the highest level since the crash following the US Presidential Election.
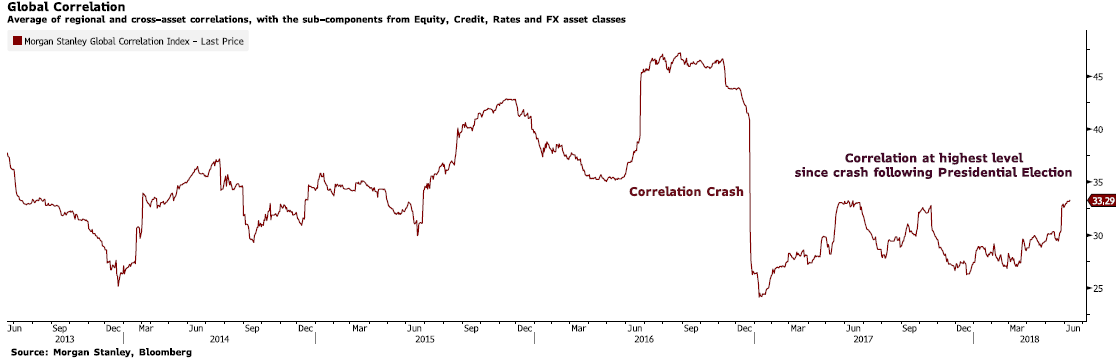
Is there a reason to believe that the second half of 2018 will mimic last year? Of course, anything is possible, but given the global macro landscape, the catalyst to spur high offsetting sector dispersion (i.e., lower correlation) is elusive. If anything, the pending catalysts argue for higher correlation.
Secondly, since the stock market discounts outcomes six-months in advance, forecasters are already releasing their US corporate earnings estimates for 2019. While still positive on an absolute basis, the estimates have returned to their normal growth rates of 8-10% as the boost from tax reform passes. Worded differently, six months from now, the base effects that benefited the stock market this year are going to detract from it. It is also worth noting that next year’s earnings estimates assume continued US business spending strength, a flattish US dollar, and range bound crude oil prices. However, little emphasis so far is being placed on the following headwinds:
1. Higher funding costs
2. Margin pressures from higher unit labor costs
3. A trade war that negatively impacts small business sentiment and leads to less CAPEX spending. Remember, corporations waited to make plans until tax policy was finalized. Now, businesses are slowing the deployment of those plans until clarity evolves regarding trade.
4. A slowdown in buyback activity after foreign profit repatriation slows and because of the high leverage level corporations find themselves in at this late stage of the cycle.
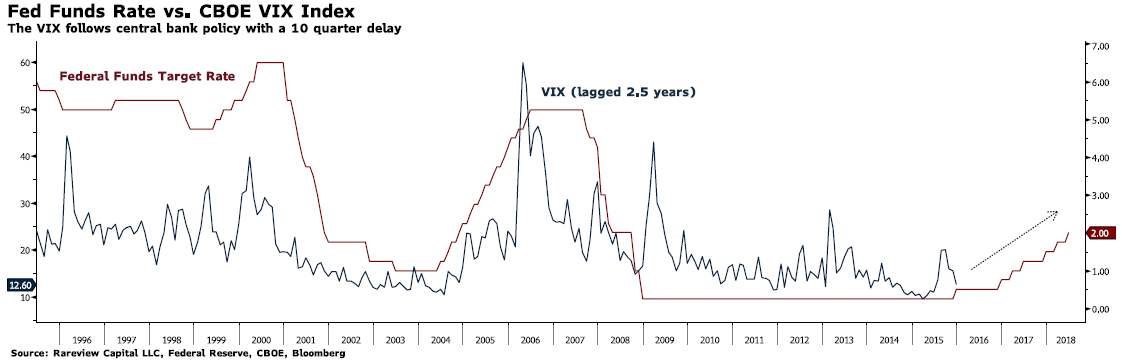
Thirdly, we find that volatility is a 30-month delayed reaction to activity by the Federal Reserve. The Fed began raising interest rates in December 2015, suggesting that volatility should begin rising in earnest in June 2018.
Ultimately, I believe that financial assets are underestimating the implications of the Fed tightening. Currently, broad markets are priced for the Fed to nail the challenge of tightening at just the right pace to prevent either a slump or an overheating, a task that no central bank has ever accomplished without hardship.
So far, since the Fed moved into a more deliberate tightening campaign late last year, there has been a rolling bear market across asset classes, regions and sectors. The list of casualties or “pop-up thunderstorms” in the weakest links in the capital markets is noteworthy.
In December, the speculative bubble in cryptocurrencies popped. In January, there was a significant tightening in front-end funding markets, including Libor-OIS widening materially. In February, following the record move higher in the CBOE Volatility Index, multiple retail-oriented products that target lower volatility ceased to exist in the span of 24-hours. In the first five months of 2018, the equities of European banks entered a bear market. The Italian bond market, the seventh largest in the world, in response to the formation of a new populist government, witnessed their 5yr bond drop 6% in one-day. The currencies of Argentina, Turkey, and Brazil fell between 20-35%, while many other emerging market countries with a weak Balance of Payment profile suffered because of higher crude oil prices.
Next, in an extension from the weakest links in capital markets to one of the safest parts of the corporate capital structure, in the first quarter of 2018, at one point, US investment grade credit was annualizing total returns of -20%, the worst performance in 35 years.
Collectively, in the intermediate-term, I believe equity market beta is likely to play less of a role in generating positive returns and the floor for volatility is closer to current levels than to the 2017 lows.
So, armed with this information, what do you do if you need equity exposure but want it at a reduced risk?
The answer is to seek out funds that have an attractive total return and lower volatility profile than the benchmark Index – that is, overwrite or covered call strategies.
Because upward momentum in equities moderated and volatility increased, equity overwrite and covered call strategies could potentially lead to a better risk-adjusted return than an index fund. Put another way, because of the elevated level of implied volatility, the stand-still return from an overwrite or covered call strategy increases substantially.
As a way of background, S&P 500 overwrite or covered call strategies, on average, sell 2-month at-the-money call options.
Last year, the average implied volatility for the S&P 500 2-month at-the-money call option was 9.77, which translates into an annualized standstill return of 11%.¹
This year, the average implied volatility for the S&P 500 2-month at-the-money call option is 13.22, which translates into an annualized standstill return of 14.6%, or 35% higher than last year.²
If S&P 500 2-month at-the-money call options were to return to its historical implied volatility norm – 17.34 – that would translate into an annualized standstill return of almost 20%.³
As highlighted earlier, we find that volatility is a 30-month delayed reaction to activity by the Federal Reserve. So, what happened to volatility 30 months following the start of the last Fed tightening cycle in 2004-2006?
As you can see, over the next 18 months, S&P 500 2-month at-the-money implied volatility averaged 17.60, near its long-run average.⁴
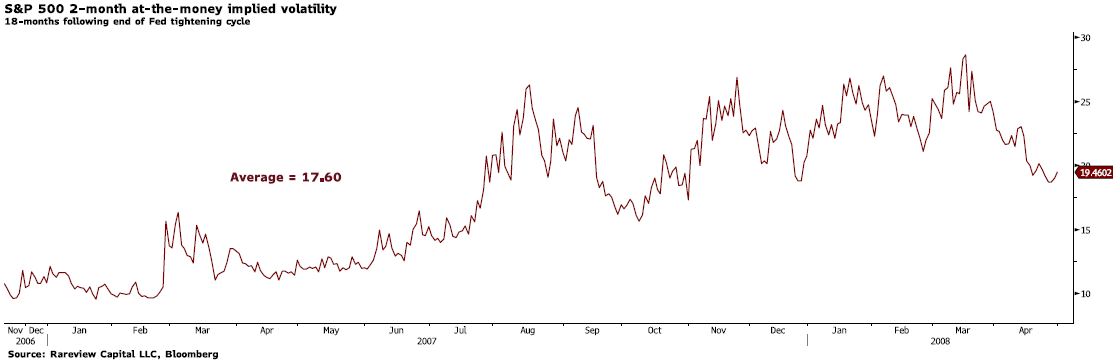
The key point here is that if implied volatility follows the same pattern during this Fed tightening cycle as the last one or returns to its historical norm, the total return for overwrite or covered call strategies should increase.
Finally, US high yield credit spreads are currently at their tightest level this cycle. Combined with the record high leverage for US corporations, there is asymmetric risk that spreads could widen moving forward, causing negative excess returns. Equity overwrite and covered call strategies offer the potential to generate a similar amount – or more – of income, with significantly less beta to the equity market. Additionally, because the level of profit growth has not slacked, there is the potential for principal appreciation, which we do not think is available in high yield corporate bonds. While neither have a great risk-to-reward valuation, on a relative basis, equity overwrite and covered call strategies offer a better potential total return.
_ _ _ _ _ _ _ _ _ _
If you are interested in learning more about how we use closed-end funds to construct portfolios in separately managed accounts (SMA), including which equity overwrite and covered call strategies we are implementing, please call us at 203-539-6067 or email us at info@rareviewcapital.com.
Footnotes:
¹Source: Rareview Capital LLC, Bloomberg, measurement period from January 1, 2017 to December 31, 2017, backup data available upon request.
²Source: Rareview Capital LLC, Bloomberg, measurement period from January 1, 2018 to June 20, 2018, backup data available upon request.
³Source: Rareview Capital LLC, Bloomberg, measurement period from February 1, 2006 to June 20, 2018, backup data available upon request.
⁴Source: Rareview Capital LLC, Bloomberg, measurement period from November 2, 2006 to April 30, 2008, backup data available upon request.
Past performance is not necessarily indicative of or a guarantee of future results
Disclaimer
This material is for informational purposes only and does not constitute an offer or a solicitation to buy, hold, or sell an interest in any investment or any other security, including any investment with Rareview Capital LLC (“RVC”) or any of its affiliates or any other related investment advisory services. This material is not designed to cover every aspect of the relevant markets and is not intended to be used as a general guide to investing or as a source of any specific investment recommendation. This material does not constitute legal, tax, or investment advice, nor is it a substitute for such professional advice or services, nor should it be used as a basis for any decision or action that may affect your business. Before making any decision or taking any action that may affect your business, you should consult a qualified professional adviser. All opinions and views constitute our judgments as of the date of writing and are subject to change at any time without notice. In preparing this material, RVC has relied upon data supplied by third parties. RVC does not undertake any obligation to update the information contained herein in light of later circumstances or events. RVC does not represent the information herein is accurate, true or complete, makes no warranty, express or implied, regarding the information herein, and shall not be liable for any losses, damages, costs or expenses relating to its adequacy, accuracy, truth, completeness or use. This material is subject to a more complete description and does not contain all of the information necessary to make any investment decision, including, but not limited to, the risks, fees and investment strategies of an investment. All investments carry a certain degree of risk, including the possible loss of principal. There is no assurance that an investment will provide positive performance over any period of time. There are specific risks that apply to investment strategies. Closed-end funds frequently trade at a discount to their net asset value. These risks should be reviewed carefully before taking any investment action. Since no one investment style or manager is suitable for all types of investors, this site is provided for informational purposes only. The statements contained herein are the opinions of RVC. This site contains no investment advice or recommendations. Individual investor results will vary. Rareview Capital LLC expressly disclaims all liability in respect to actions taken based on any or all of the information on this writing. Past performance is no guarantee of future results.
There are risks inherent in any investment including the possible loss of principal. There can be no assurance that separate account objectives will be achieved. Closed-end funds are traded on the secondary market through one of the stock exchanges. The Fund’s investment return and principal value will fluctuate so that an investor’s shares may be worth more or less than the original cost. Shares of closed-end funds may trade above (a premium) or below (a discount) the net asset value (NAV) of the fund’s portfolio. There is no assurance that a Fund will achieve its investment objective. Past performance does not guarantee future results.
Prior to buying or selling an option, investors must read a copy of the Characteristics & Risks of Standardized Options, also known as the options disclosure document (ODD). It explains the characteristics and risks of exchange traded options. Copies are available by calling 1-888-OPTIONS, or from The Options Clearing Corporation at www.theocc.com.