
by Neil Azous, Chief Investment Officer
Taking Stock
On Monday, March 12th, we wrote a blog post titled: “Why We Are Still Not Afraid of Higher Yields.”
On Friday, March 9th, the 10-year US Treasury yield closed at 2.893%. Since that day, the average yield is 2.899%. Currently, it is 2.893%.
Also, we wrote that the neutral rate for the Federal Reserve’s tightening cycle would be at ~1.75%, which we believe was reached at either the March or June meeting. For clarity, the Fed funds effective rate after the March hike was 1.66%, and 1.91% after the June hike.
None of the views we sketched out in March are different today. In fact, with six months passing, many views have been validated, or are close to fruition.
Yield Curve
Today, the main talking point amongst fixed income investors is the shape of the yield curve, specifically what it means now that it is close to inverting.
Now, depending on an investor’s discipline, the yield curve means different things. For some, the yield curve inverting is an indicator that a recession is looming in the intermediate-term. For others, it means the stock market has a finite period for further appreciation, potentially another year, before discounting the economic downturn.
For us, what is most relevant are the inflection points the yield curve reveals along the way to inversion because they help risk manage principal losses for fixed income holdings. Put another way, we are less interested in the predictive power of the yield curve inverting for how long it will take until a recession occurs, and more interested in the insights we can glean in real-time to attempt to safeguard against potential losses.
Yield Curve Framework
To determine the probabilities for the path of interest rates, and by extension, US fixed income asset prices, we rely on our proprietary analytic toolkit, specifically our Federal Reserve super-forecasting model.
Similarly, when analyzing the yield curve, we are process-driven. Whether the shape of the yield curve is steep, flat, or inverted, the time-tested framework we sketch out below has served us well.
So, today, with the nominal US Treasury yield curve at very flat levels, what is our framework revealing regarding US fixed income asset prices?
Eurodollars – Yield Curve Already Inverted
To answer the above question, we analyze short-term interest rates (STIRs), called Eurodollars.
Eurodollar futures and options markets are the most liquid and flexible in the world, trading on average more than $1 trillion in notional per day. The wide variety of instruments available allow investors, almost in a “digital” like manner, to re-create interest rate probabilities generated from a scenario analysis. Simply, the Eurodollar market provides the most fixed income insight of all instruments.
Currently, the Eurodollar market is showing that the yield curve has already inverted.
It is just a matter of time – between September and December – that the traditional nominal yield curves will follow. This is not a leap considering the 2/10’s US Treasury nominal yield curve is at ~20 basis points today, and the probability of hiking interest rates at both the September and December meetings is above 75% or viewed by the market as very likely.
Eurodollars: Watching The Yield Curve Invert In Real-Time
Below is a table of the 12-month Eurodollar futures calendar spreads. The dates listed are the first time that they had inverted since the beginning of the Federal Reserve’s tightening cycle in December 2015. Note, any calendar spreads between 3- and 24- months shows similar degrees of inversion.
For example, the first Eurodollar spread inversion occurred in the far deferred 12-month period in April. The second inversion happened after the June FOMC meeting.

As you can see from the table, the inversion of the Eurodollar market has moved closer in time over the last four months. It is an important evolution because as we show below, it communicates that the Federal Reserve will likely be done raising interest rates by or before the end of 2018.
Historically, when the Eurodollar calendar spreads invert near the 1-year time frame (i.e., the 4th or 5th Eurodollar future), it signaled that the Federal Reserve imminently stopped raising interest rates. Following the September meeting, as a function of the Eurodollar curve rolling forward by one contract because the September 2018 future expires, the 5th Eurodollar 1-year calendar spread (i.e., the 6th vs. 10th future today) will be inverted.
Note, whether the last hike is at the September or December meeting is less material because US interest rate markets currently discount an additional ~35 basis points of tightening by the Federal Reserve after the December meeting. So, there is significant scope for yields to decline if December is the last interest rate hike of the cycle.
Yield Curve Phases
The following flow diagram details the different phases of yield curve inversion in the US fixed income markets, and what that historically indicates will happen in the future regarding Federal Reserve interest rate policy and the impact on fixed income asset prices.

Phase 1
At the end of April, signs of Phase 1 appeared in the US interest rate markets, which indicated that the Federal Reserve would likely stop raising interest rates by the end of the year.
Specifically, the signal observed was in more deferred Eurodollar futures spreads, such as the 12th vs. 16th – or a future that is 3-years vs. 4-years forward in time – beginning to invert or reach zero for the first time in this tightening cycle.
Historically, this signals that the current level of yields is unlikely to be exceeded in the intermediate-term in any measured way, and thus that significant principal losses on fixed income were unlikely for the remainder of the cycle.
Since then, consistent with the information observed back in March from our Federal Reserve super-forecasting model, and the inversion in the deferred part of the Eurodollar futures curve in April, the 10-year Treasury yield is effectively in the same place.
Phase 2
Following the June FOMC meeting, past the point of what we believe to be the neutral interest rate, the fixed income market transitioned into Phase 2, likely signaling that the Federal Reserve would create “restrictive” monetary policy should it follow through on its intent to raise interest rates to 2.5% in 2018, and beyond into 2019.
Specifically, the inversion in Eurodollar futures 1-year spreads moved forward to the 8th and 9th futures contract – or a future that is 2 years forward in time – the day after the June FOMC meeting.
Historically, this reinforces the view that yields have largely plateaued for the cycle, and thus principal losses on fixed income were minimal for the duration of the cycle, and there was the potential for excess returns.
Phase 3 – We Are Here
Towards the end of August, the fixed income market began its transition to Phase 3. Specifically, the inversion in the Eurodollar futures market accelerated forward along the curve, close to the 5th Eurodollar future – or a future that is 1-year forward in time. This acceleration is mainly because of pulling expectations forward for the Federal Reserve to stop raising interest rates, rather than time passing. Worded differently, the Eurodollar inversion moved forward in time by two years over the last four months.
Historically, in past tightening cycles, when all other yield curves were inverted, and the inversion had moved this far up in the Eurodollar market, it has indicated that the Federal Reserve is within 1 to 2 months of its tightening cycle ending. At that point, the risk of principal losses – i.e., higher yields – was de minimis.
The below chart shows the 12-month spread between the 5th and 9th Eurodollar futures today. Once the Eurodollar futures curve rolls forward by one contract on September 14th, the 5th vs. 9th spread will be inverted and the yield curve will officially enter Phase 3.

Phase 4
Most of the academic research on the yield curve has focused on determining when the market is in Phase 4, and when that means the US economy is going into a recession.
This pedestrian view misses the key point. In all historical cases, Phase 4 has been coincident with the Federal Reserve already cutting interest rates or preparing to do so. By that time, the Federal Reserve had long stopped raising interest rates.
Therefore, the takeaway from the inversion of the yield curve is how far will yields decline and how much the market believes the Federal Reserve will lower interest rates in the future.
We anticipate this event could begin in earnest in the summer of 2019.
Stress Test
As stated above, when the Eurodollar calendar spreads invert near the 1-year time frame (i.e., the 4th or 5th future), it signaled that the Federal Reserve imminently stopped raising interest rates.
The below table shows what conditions have been present when the 4th/8th Eurodollar calendar spread inverts in past Federal Reserve hiking cycles, and what has happened next to fixed income.
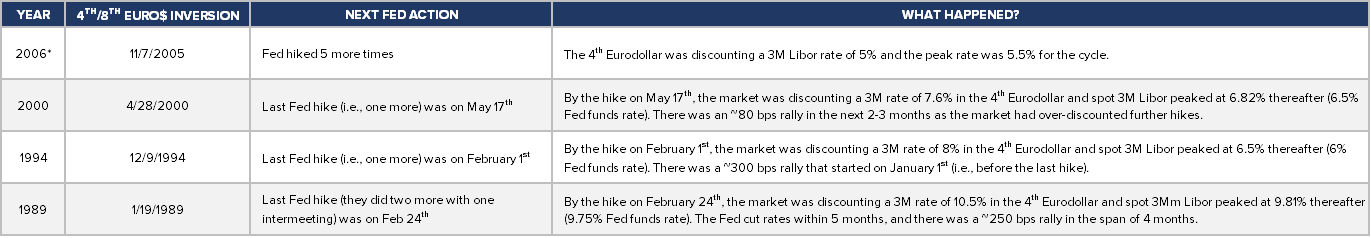
*In 2006, the key difference relative to the 2018, 2000, 1994, and 1989 Federal Reserve hiking cycles was that the more deferred Eurodollar futures contracts never inverted, they stayed moderately positive throughout the cycle. Therefore, we believe the 2000, 1994, and 1989 cycles are a more appropriate historical precedent for the 2018 cycle, specifically the 2000 scenario.
As you can see, the stress test above meets the criteria for Yield Curve – Phase 3 – that is, based on history, the Federal Reserve is within 1 to 2 months of its tightening cycle ending.
Where Are We Wrong?
The following catalysts could negate the framework sketched out above and lead to the Federal Reserve continuing its tightening cycle into 2019, or beyond the 35 basis points of tightening that is already priced in the market after the December FOMC meeting.
Note, if you hold this view, it is predicated on the Federal Reserve hiking interest rates well into an inverted yield curve.

The indicator we would be most concerned about is Financial Conditions easing because of a significant appreciation in stock prices. At the recent Jackson Hole symposium, Federal Reserve Chair Powell commented on “excesses.” His key point was that “in the run-up to the past two recessions, destabilizing excesses appeared mainly in financial markets rather than in inflation. Thus, risk management suggests looking beyond inflation for signs of excesses.” In plain English, that means there is a risk of hiking interest rates into a yield curve inversion to stop stock prices from rising further.
Conclusion
Absent one of the indicators highlighted above materializing, we believe the US fixed income market is communicating that the Federal Reserve will likely be done raising interest rates by or before the end of 2018.
As a result, we believe the risk of principal loss in fixed income assets over the intermediate-term is far less likely than at the start of 2018.
Overall, we believe we are not far from the point where the general negative sentiment towards income-oriented assets being in a “rising interest rate environment” is ending.
If you are interested in learning more about how we use our Federal Reserve model to potentially mitigate the risk of rising interest rates in your portfolio or for your clients, please call us at 203-539-6067 or email us at info@rareviewcapital.com.
Disclaimer
This material is for informational purposes only and does not constitute an offer or a solicitation to buy, hold, or sell an interest in any investment or any other security, including any investment with Rareview Capital LLC (“RVC”) or any of its affiliates or any other related investment advisory services. This material is not designed to cover every aspect of the relevant markets and is not intended to be used as a general guide to investing or as a source of any specific investment recommendation. This material does not constitute legal, tax, or investment advice, nor is it a substitute for such professional advice or services, nor should it be used as a basis for any decision or action that may affect your business. Before making any decision or taking any action that may affect your business, you should consult a qualified professional adviser. All opinions and views constitute our judgments as of the date of writing and are subject to change at any time without notice. In preparing this material, RVC has relied upon data supplied by third parties. RVC does not undertake any obligation to update the information contained herein in light of later circumstances or events. RVC does not represent the information herein is accurate, true or complete, makes no warranty, express or implied, regarding the information herein, and shall not be liable for any losses, damages, costs or expenses relating to its adequacy, accuracy, truth, completeness or use. This material is subject to a more complete description and does not contain all of the information necessary to make any investment decision, including, but not limited to, the risks, fees and investment strategies of an investment. All investments carry a certain degree of risk, including the possible loss of principal. There is no assurance that an investment will provide positive performance over any period of time. There are specific risks that apply to investment strategies. Closed-end funds frequently trade at a discount to their net asset value. These risks should be reviewed carefully before taking any investment action. Since no one investment style or manager is suitable for all types of investors, this site is provided for informational purposes only. The statements contained herein are the opinions of RVC. This site contains no investment advice or recommendations. Individual investor results will vary. Rareview Capital LLC expressly disclaims all liability in respect to actions taken based on any or all of the information on this writing. Past performance is no guarantee of future results.
Futures trading contains substantial risk of loss and is not suitable for every investor. An investor could potentially lose all or more than their initial investment. Risk capital is money that can be lost without jeopardizing ones financial security or lifestyle. Only risk capital should be used for trading and only those with sufficient risk capital should consider trading. Past performance is not necessarily indicative of future results. In light of the risks, you should undertake such transactions only if you understand the nature of the contracts (and contractual relationships) into which you are entering and the extent of your exposure to risk. Trading in futures and options is not suitable for many members of the public. You should carefully consider whether trading is appropriate for you in light of your experience, objectives, financial resources and other relevant circumstances.
Prior to buying or selling an option, investors must read a copy of the Characteristics & Risks of Standardized Options, also known as the options disclosure document (ODD). It explains the characteristics and risks of exchange traded options. Copies are available by calling 1-888-OPTIONS, or from The Options Clearing Corporation at www.theocc.com.